
View Video Abstract on Cell website,
Featuring Jeff Lichtman, MD, PhD, and Daniel Berger, PhD
The Incredible Amount We Can Learn from Electron Microscopy Reconstruction of Less Than 0.000001% of the Mouse Brain
by Parizad M. Bilimoria
When it comes to science, perhaps the wisest among us are those who know how much we don’t know. The famous 19th century neuroanatomist Santiago Ramón y Cajal, who many would argue did more to characterize the different cell types that make up the nervous system than any other scientist of his time, once described the adult brain as a ‘jungle’ that is ‘impenetrable and indefinable.’
Over a hundred years later, despite an explosion of new technologies in microscopy and genetic and immunological methods of brain cell labeling, neuroscience research remains chock full of uncharted territories. In a recent publication in Cell, a team led by Jeff Lichtman, the Jeremy R. Knowles Professor of Molecular and Cellular Biology at Harvard—fittingly also named the Santiago Ramón y Cajal Professor of Arts and Sciences—presents the latest chapter in this story, by providing unparalleled views into the intricacies of synaptic connectivity in the cerebral cortex and revealing novel insights about this connectivity—while simultaneously highlighting just how much we have left to discover.
The new study offers the first detailed foray into the neocortex, with a stunningly saturated reconstruction of a volume of mouse cortical tissue of about 1,500 cubic microns obtained at a resolution fine enough to allow the identification of every single synaptic vesicle within. This is remarkable considering how incredibly small synaptic vesicles are, how many synaptic vesicles are present at each synapse, and how many different synapses each neuron has.
From the reconstructed images, a database of exactly 1,700 synaptic connections—mostly excitatory synapses—was created and mined. The most striking finding to emerge so far, says Lichtman, also a member of the Center for Brain Science and Conte Center at Harvard, is that proximity does not dictate connectivity. In other words, in the adult brain, at least in the piece of cortex imaged thus far, axons do not appear to form synapses with dendrites randomly, based on how close together they are. Instead, certain axons prefer certain dendrites and those pairs tend to form multiple synaptic connections together while avoiding synapses with other neurons in the very same region. This finding may present new considerations for computational brain mapping endeavors such as the European Brain Project, that currently are based at least in part on the assumption that patterns of connectivity can be predicted from the overlap of axons and dendrites.
Insights were gained on other fundamental questions about the organization of excitatory synapses and the subcellular organelles within them as well. One interesting example is that axonal varicosities—swellings along the axon filled with synaptic vesicles—are often multi-synaptic sites which involve more than one dendritic spine, contrary to how they are usually drawn in textbooks.
Beyond the new knowledge gained, what’s equally remarkable to note is that this study involved 21 authors, seven academic departments from four different universities, about six years of research, the assistance of hundreds of student interns and innovations in every single step of the process—from cutting ultrathin brain sections for the scanning electron microscope and imaging those sections to aligning the images in 3D stacks and labeling the cellular elements within. And yet the total volume imaged represents less than 0.000001% of the mouse brain. This statistic drives home the point that there is a tremendous amount of the jungle still to be explored.
“[W]e think that this ‘omics’ effort lays bare the magnitude of the problem confronting neuroscientists who seek to understand the brain,” the authors plainly state at the conclusion of their paper, referring to ‘connectomics’—a young field which they have helped to launch. The ultimate goal of connectomics, as they define it, is to map all of the synaptic connections within the brain or nervous system, obtaining a high resolution ‘wiring diagram’ that can be studied across different stages in development and in disorders in which neural connectivity is suspect.
Challenging naysayers
Looking at some of the breathtaking images in the current publication, one might assume that the value of connectomics is undisputed and that this type of nanometer resolution EM reconstruction of neural circuits has long been the dream of neuroscientists everywhere. That how to get there was the only question. But in fact the utility of this painstakingly detailed type of connectomics has long been debated.
Is it merely descriptive? Will it provide real biological insights? Is it a good use of already scarce research funds? Is it even possible? These were some of the sea of questions the team faced at the onset of this venture—and still does, to a lesser extent.
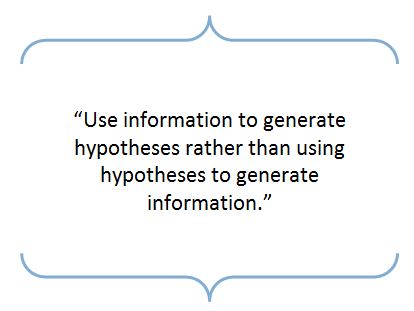
However, the only question that truly concerned Lichtman’s team was the last one—whether it was possible to do EM connectomics at the resolution and scale they envisioned. Descriptive biology is a venture they wholeheartedly embrace. As Lichtman has said in the past, his lab’s approach is to “use information to generate hypotheses rather than using hypotheses to generate information.”
In 2008, along with Joshua Sanes, Director of the Center for Brain Science and the Jeff C. Tarr Professor of Molecular and Cellular Biology at Harvard, Lichtman wrote a review comparing the early days of connectomics with the early days of genomics. The point was that the Human Genome Project—the effort to map the full DNA sequence of all the genes in a human being—was similarly controversial and impossible-sounding, and yet today no one would question its value. In 2013, Lichtman wrote another commentary, this time with postdoctoral fellow Joshua Morgan, also an author on the recent Cell paper, taking down the ‘top ten arguments’ against connectomics.
But the question of what was technically possible was much harder to address. Lichtman realized early on that it would take a great deal of time and patience. “I could not do this in the traditional scientific way where you publish a little paper at each step. This was a big project,” he says.

Brain Sections Being Cut for Electron Microscopy Using the Automated Tape-Collecting Ultramicrotome (ATUM). The inset shows a diamond knife sectioning a small chunk of brain tissue mounted to an ultramicrotome. These ultrathin sections float over a ‘water boat’ onto a moving reel of tape to create the ‘brain on tape.’ Figure excerpt from Kasthuri et al. Cell 2015.
Step by step, he enlisted the efforts of people both within and beyond his lab to push the boundaries of what was possible in terms of automating and speeding up the EM pipeline. The first step was cutting thinner brain sections to obtain higher quality images. At the onset of the project, the lab was cutting 20 micron sections. Now they’re down to 29 nanometers—almost a thousand times thinner. The cutting is done with a four to five thousand dollar knife made of diamond, the hardest material in the natural world, on a device called the automatic tape-collecting ultramicrotome (ATUM). The chunk of brain tissue being cut is embedded in a plastic block. As they’re cut, the sections adhere to a moving reel of tape in sequence to create what the team likes to call “a brain on tape.” Many of the improvements in this cutting process were developed by Kenneth Hayworth, a former postdoctoral fellow in Lichtman lab who is now a senior scientist at Janelia Farm, along with the study’s first author, Narayanan ‘Bobby’ Kasthuri, a former postdoctoral fellow who is now an independent researcher at Argonne National Labs and Richard Schalek, a senior research associate in the lab.
Next the team faced the challenge of imaging the sections on the tape at high speed. When the sections are incredibly thin and many thousands must be imaged consecutively, the process has to be automated and efficient. In the current system, the ‘brain on tape’ is cut into strips, mounted onto silicon wafers, stained with an agent that improves contrast, and then placed in a scanning electron microscope. Multi-scale datasets are gathered, so that there is some low and medium resolution contextual information about the area surrounding the high resolution circuit reconstruction. This means the same series of brain sections must be imaged multiple times, with high reliability and sustained sample quality. Figuring out how to optimize this process was no trivial matter. At the onset, even the fact that this could be done well with a scanning electron microscope over another type, the transmission electron microscope, was unknown. Kasthuri made this determination and oversaw the acceleration of the imaging process over several years. Along the way, Daniel Berger and Joshua Morgan, current postdoctoral fellows in the Lichtman lab, as well as Hayworth, wrote several different software programs to optimize the reliability and speed of image acquisition.

After imaging comes the hard work of aligning all the images in a 3D stack and ‘segmenting’ them—essentially going through and labeling piece by piece each element in each section of the stack—identifying first it’s a piece of a neuron, glial cell, or blood vessel, and then, for each piece of neuron, if it’s an axon or dendrite, what organelles it contains and where the synaptic sites are, etc. Early on, most of the process was manual. Berger developed a software program called VAST that allowed the team to segment images using a ‘coloring book’ approach, where they would go in and trace the boundaries of each cellular element and annotate its identity. About two-thirds of the data in the current study comes from this manual approach, with tracings efforts led by Kasthuri and Berger.

Multiscale Reconstruction of Mouse Cerebral Cortex.
Panel A shows the various layers of cortical tissue imaged overall. Panels B and C show manual and automated segmentations of everything within a single section in the area reconstructed at highest resolution.
Panel D shows a 3D rendering of the cell bodies and apical dendrites of two pyramidal neurons highlighted in the analysis—created by stacking together many single section images of the type shown in B and C. The multicolor cylinder near the pink arrow in D marks the small pieces of dendrite around which the highest resolution reconstruction was performed. (Note that the arrows in D correspond to the arrows in A, illustrating the ‘zoom-in’ to layer 5 of cortex.)
Panel E shows a closeup of the cylinder highlighted in D, and panels F through N show all the parts within, from different types of axons and dendrites to pieces of glial cells.
Figure excerpt from Kasthuri et al. Cell 2015.
Over the years, however, the Lichtman lab joined forces with the lab of Hanspeter Pfister, the An Wang Professor of Computer Science and Director of the Institute for Applied Computational Science at Harvard’s School of Engineering and Applied Sciences, to develop software for automated segmentation. Various programs, including RhoANA and the associated proofreading and annotation tool Mojo, were written by Seymour Knowles-Barley, a former postdoctoral fellow currently at Google, in concert with Mike Roberts, Ray Jones, Verena Kaynig, Amelio Vázquez-Reina and colleagues. These programs significantly speed up the image analysis process, but currently do still require humans to inspect each processed section, correcting the computer’s occasional segmentation errors and identifying what each segmented element represents.
As these examples illustrate, this massive project required a large amount of teamwork. “No human being on the planet has enough expertise to complete the entire project,” Lichtman states. “Many of the authors whose names are buried somewhere in the middle are no less essential than any other name.”
He expresses a great deal of gratitude also for the hundreds of student interns who contributed to the segmentation efforts. These interns ranged from the high school to graduate school levels—including students visiting from other countries. In addition to support from the Lichtman lab and Conte Center, some of these interns received funding from the Center on the Developing Child at Harvard—a group ultimately interested in obtaining an EM resolution answer as to how brain wiring is affected by early life adversity.
He notes that this teamwork and the student involvement continue and all of the steps in the EM connectomics pipeline are still being refined. “None of these things are finished. They’re all being improved all of the time.”
In fact, the entire dataset shown in the Cell paper is less than one terabyte in size, while current projects in the lab—such as a thin sliver of the brain that’s about one square millimeter—are closer to 100 terabytes. By comparison, NASA’s Hubble Space Telescope, which can look out at galaxies beyond our own, is said to collect about 10 terabytes of new data each year.
Surprises and next steps

A Pair of Neurons that Form Multiple Synapses with Each Other. In blue is an axon and in green a dendrite. The five orange dendritic spines show the multiple sites at which this axon and dendrite form synapses. The white arrows point to two axonal varicosities that synapse with other neurons’ dendrites (now shown). This is one of the more extreme examples in the dataset, highlighting how certain pairs of neurons preferentially form synaptic contacts with each other over other neurons—making many more synapses than would be expected if connectivity were based on axon and dendrite proximity alone. Figure excerpt from Kasthuri et al. Cell 2015.
Unexpectedly, one of the hardest parts of the project came at the end, when there were thousands of beautiful images properly segmented and aligned in 3D stacks. The team needed a way to make sense of all that information.
“What was really hard was something I didn’t think was going to be hard at all,” Lichtman says. “Which was turning that segmented data into an analyzable dataset. A bunch of pictures of segmented wires isn’t data until you turn it into some form amenable to statistical analysis.”
Since the goal of the project was to understand neural connectivity at the synaptic level, the team decided to create a database of synapses. Each synapse was given a numeric identity, and for each one, they kept track of all the information they could think of. For instance, was the synapse excitatory or inhibitory? Which axon was the pre-synaptic site located on? Which dendrite was the post-synaptic site located on? What other axons and dendrites were in the vicinity? How many synaptic vesicles were present? Where were the mitochondria and how many were there? What was the volume of the dendritic spine, if there was one? The diameter of its neck?

The Dense Tangle of Axons Contacting a Single Dendritic Spine.
In red is a single dendritic spine and in the other colors are twelve axons that ‘touch’ this spine. Yet only one of these twelve axons (the yellow one, pointed out by the arrow) makes a synapse with this spine. Figure excerpt from Kasthuri et al. Cell 2015. To view supplementary movie, click here.
It was only through building this type of database that they could arrive at the conclusions discussed in the paper, from the major finding of proximity not predicting connectivity to finer points such as where mitochondria are concentrated. (They tend to be present in axonal varicosities with lots of synaptic vesicles – very rarely in dendritic spines. And occupy much more volume in inhibitory dendrites than excitatory dendrites.)
Many more questions remain to be answered, and the researchers have made the synapse database publically available so that others can mine it as well.
Does the lab have any ideas as to why proximity does not predict connectivity?
“Of course,” is Lichtman’s first answer. The current sample came from an adult mouse brain. Perhaps in baby brains the synaptic connections are more random. As environmental experiences sculpt neural circuits, the connections between certain pairs of neurons might increase in number or strength, while others, unused, might be pruned away.
But Lichtman quickly adds that he’d prefer to gather the data from younger brains before making such predictions. “It goes against my philosophy to even have an idea like that,” he observes with a smile.
In addition to the ongoing work of improving the EM pipeline, the lab is beginning collaborations to apply its latest methods to human brain tissue, as well as a connectomics analysis in mice modeling Rett syndrome, a severe neurological disorder with autism-like features. Since it is hypothesized that neural connectivity is disrupted in many neurodevelopmental disorders, including psychiatric illnesses, connectomics researchers hope that comparingwiring diagrams in ‘normal’ vs. disorder-affected brains will identify some of the underlying pathology and modify how treatments are developed.
Additionally, to complement the current findings on excitatory synapses, the lab is interested in learning more about inhibitory synapses within the new samples. From a practical perspective, inhibitory neurons are often smaller in size than excitatory neurons and their cell bodies might be imaged in the same dataset as their dendritic trees—a huge advantage, as in the current study, the high resolution dataset centered around one tiny part of a couple excitatory neurons’ dendritic trees, far from their cell bodies. Also, as part of its work in the Conte Center at Harvard, focused on developmental origins of mental illness, the lab is particularly eager continue its efforts to map the synaptic fields of PV-cells, a type of inhibitory neuron suspect in the pathology of various neurodevelopmental and psychiatric disorders.
PV-cells play a pivotal role in the timing of critical periods of plasticity during brain development, and are known to be exquisitely vulnerable to a number of genetic and environmental insults linked to mental illness. Alterations in the appearance or function of PV-cells have been noted across a wide range of mouse models of autism and schizophrenia, as well as in human pathology and brain wave studies.
“We have known for some time that PV-cells are of great interest in mental illness. But the connectome of the PV-cell is a mystery we are just beginning to unravel,” says Takao Hensch, director of the Conte Center and Professor of Molecular and Cellular Biology and Neurology at Harvard and Boston Children’s Hospital. “If we can obtain an electron microscopy-based map of PV-cell connectivity at the scale and resolution the Lichtman team has now made possible, and observe how this map is perhaps altered in models of autism or schizophrenia, we may gain very useful new insights into the root pathologies in these disorders.”
For More Information:
Read the original research article in Cell:
Saturated Reconstruction of a Volume of Neocortex. Kasthuri N, Hayworth KJ, Berger DR, Schalek RL, Conchello JA, Knowles-Barley S, Lee D, Vázquez-Reina A, Kaynig V, Jones TR, Roberts M, Morgan JL, Tapia JC, Seung HS, Roncal WG, Vogelstein JT, Burns R, Sussman DL, Priebe CE, Pfister H, Lichtman JW. Cell. 2015 Jul 30;162(3):648-61.
Access the dataset here:
http://www.openconnectomeproject.org/
Read Jeff Lichtman’s summary of the study on the Harvard Molecular and Cellular Biology website.
Additional Resources:
Connectomics: Big Microscopes & Tiny Synapses. A video made in 2014 for Harvard’s Neurobiology of Behavior course, featuring Jeff Lichtman and Bobby Kasthuri.
Crumb of mouse brain reconstructed in full detail: Digital map is step towards reconstructing a whole human brain. Nature news article by Alison Abbott, with video. July 30, 2015.
From tiny slice, researchers lay bare beauty of mouse brain. Simons Foundation Autism Research Initiative (SFARI) news story by Jessica Wright. July 30, 2015.
3D brain map reveals connections between cells in nano-scale. The Guardian news piece by Helen Thomson. July 30, 2015.
These Stunning Images Will Take You On A Journey Through The Brain. Huffington Post story by Carolyn Gregoire. August 4, 2015.